Sunday, October 31, 2021

Portfolio Update October 2021

During October we have seen a substantial amount of companies report their Q3 earning, some have reported record profits while other have disappointed all expectations. A normal quarterly flow of reports, some good, some bad and others do not move the markets. As stocks have their own rhythm there are new investment channels such as crypto currencies, NFTs (non-fungible token) and most likely something I haven't even heard about yet. The new channels have taken people with storm, increasing in value beyond my understanding.  

As my portfolio swing month to month it is interesting to follow-up which are the biggest holdings based on market value.

 Currently my largest portfolio holdings are 

  1. Nordea Bank 9,03%
  2. Telia Company 8,65%
  3. GlaxoSmithKline ADR 6,52%
  4. BASF 6,05%
  5. 3M Co. 5,72%

 The five biggest holdings represent almost 36% of my portfolio while top 10 largest holdings represent over 60% of my portfolio. Many might say it is a risky portfolio and poorly diversified, these people usually interpret volatility as risk while for me volatility is only opportunity. Risk is the probability of losing the investment in any form, meaning either the company files for bankruptcy without any recovery possibilities or the risk that the company loses its competitive edge and therefore sees a significant reduction in its value. There are many other views on risk as many would just use the theoretical systemic and firm specific risk and justify that volatility reflects both. 

During October a few minor changes in Top 5 largest holdings was that BASF dropped from 3rd largest holding to forth, overtaken by GlaxoSmithKline. 3M Co rose to fifth place while The Kraft Heinz Company dropped to sixth place. As I have been increasing my position in Telia it has remained one of the largest holdings in market value even as its market value has dropped.

 More details and current market value can be found on the Portfolio page.

Portfolio changes

 A few changes made during October, as usual just increased positions. Mainly looking at companies that underdelivered to market expectations and are undervalued in cash flow and which most likely could be sold at a premium to current value.

Telia

 Bought 110 shares to decrease the purchase price and to increase the coming dividend. Have a total of 1 440 shares now at a weighted average purchase price of 3,75€ compared to 3,77€ before. 

Telia announced their Q3 earnings which did not surprise me, yet the market was expecting better results based on reactions. 

Kone

Kones share dropped after Q3 publication as investors worried about Chinas impact on future profits. This gave me the opportunity to increase my position to 7 shares at a price of 57,24€, had 3 shares before at 57,25€. 

China is a large and important market for Kone, but I expect Kone to adjust fast to market changes and keep their competitive edge to competitors. A quarter here and there has hardly had a long-term impact on a company, except when they have used fraudulent accounting or deceived the public for a long time. 

Handelsbanken Latin Amerika mutual fund

Bought 30€ worth in Handelsbanken Latin Amerika fund partially driven by the decreased value, also as my long-term view remains the same. Latin Amerika has not recovered from COVID-19 caused issues and there are signals of unrest in some countries. 

Citating Baron Rothschild (not 100% sure he actually said it)

"the time to buy is when there's blood in the streets"


Dividends

October was a good month as Nordea Bank paid out their dividends for year 2019 and 2020 (note 2019 dividend should have been paid in Spring 2020, yet corona interrupted it). Old Republics extra dividend and GlaxoSmithKlines dividend helped reduce the gap to short-term goal yet not able to achieve it this year.


Received dividends in October 2021

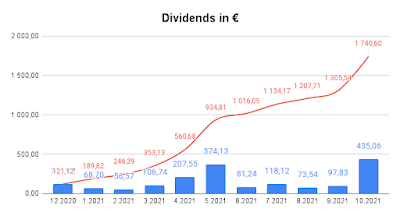
YTD dividends are about 1 600€ which is 600€ from the short-term target. Since December 2020 portfolio has received 1 740€ in dividends and all has been reinvested. The investments made in Bayer AG will hopefully give a return two years from now. Expecting Telia to pay the same dividend of 2 SEK per share next year which will increase my dividends unless SEK falls in value to EUR next year. 

Sampo has gathered some funds from the sale of its Nordea Bank shares and they announced at least a dividend of 2€ per share in 2022 which will help narrowing the gap. 

Graph shows portfolio dividend development since start


Saturday, October 16, 2021

Bayer AG an undervalued company or still high risk

 Is Bayer AG an undervalued company or still high risk due to RoundUp! court cases?

Will shortly review Bayer from my perspective and apply similar principles as with my Alibaba review, first financials, dividends and then the political or in Bayer's case the damage lawsuits impact on shareholder value. One important question be answered, is Bayer AG undervalued excluding RoundUp! and what is the case when we add RoundUp!? This will be mainly a summary of historical number and not speculation around Bayer's future profits.

Let's jump straight into the numbers.


Bayer AG Financials

Starting with Bayer's income statement since 2004 we see good revenue growth, stable gross margin while operating and net profit swings a bit. The biggest swings are due to one-off items, yet the goodwill write down made 2020 had a huge negative impact. Here we clearly see the importance of due diligence in big mergers and acquisitions as the Goodwill can eat up most of a company's equity in a very short period.

Income Statement

Revenue and gross profit including the gross margin in percentage has been very good and what we should expect from a pharma company. Even after Monsanto acquisition gross margin in percentage has stayed on the better side of 50 %. Since 2004 Bayer AGs revenue has grown by 2,35% per year which is a bit modest comparing to smaller companies, however for a big company like Bayer it is a proper result. 

The positive part is the gross margin and that we see a small growth in revenue. Even if there was years with almost no growth or declining revenue it still is normal for every company and I do not worry that much about it.

Graph displays Bayer AGs revenue, gross profit and gross margin development since 2004

Next up is Operating profit, an operating margin %. As the graph displays the margin and profit has been growing with the business from 2004 until 2018 when Monsanto acquisition was finalized. Operating margin in % dropped from a healthy 16% to under 10% (around 9,6-9,9%) which clearly reflects the negative impact from Monsanto. Only in 2004, 2009 and 2010 did Bayer have a operating margin in % below 10%, if this is the new standard then one question I ask is, what shareholder value was created with Monsanto acquisition?

Graph displayes Bayer AGs operating profit and operating margin since 2004

Net profit is what many look at and also EPS (earnings per share), as this is the result the company makes and could distribute to owners in many forms. Bayer AGs net profit has been developing well since 2004, a few highs in 2007, 2016 and 2017 mainly driven by non-reoccurring payments. In 2020 we see a big drop caused by goodwill write-down of around 2,2 billion euros and significant legal risk of 13 billion euros all related to the Monsanto acquisition (available in Bayer AGs 2020 annual report notes on page 189, other operating expenses). Without these two items we would have seen a good result from the company, however the legal claims and goodwill value of Monsanto is still a big question. We will see the impact on Bayer's balance sheet of the legal claim and goodwill write-down.

 Bayer's pay-out ratio has been moving a bit, yet dividends have risen since 2004 by 364% or equivalent to 8,4% on an annual basis. Note that Bayer decreased their dividend in 2020 from 2,80 euros to 2,00 euros reflecting the bad result in 2020. We also see that in 2018 Bayer paid out more than their result was for the year, looking a bit back that has a minor impact due to earlier years good results and lower pay-outs. If Bayer's EPS stabilizes to the average from 2004 to 2020 we would talk about an EPS of around 2,51 euros which sounds a bit low considering Bayer's normal business and operations. However, do understand why the stock is moving in the range of 46 to 49 euros.

Graph shows Bayer AGs earnings per share, ivien and pay-out ratio since 2004


Balance Sheet

Bayer's balance sheet will be discussed only briefly, will mainly focus on equity and goodwill per share as in 2020 their balance sheet ha more in goodwill then equity alone. 

Equity per share has grown well an equity ratio has displayed the same patter until 2014 were we see equity ratio drop from 40% to 29%. The reason behind the drop comes from 13,5 billion euros in acquisitions mainly funded by long-term debt. Bayer acquired Argentinian crops science company Biagro Group, Merck & Co Inc's consumer care business (largest acquisition that year) and Chinese Dihon Pharmaceutical Group. The graph clearly displays how equity ratio drops in 2014 while goodwill jumps to new highs. Still in 2014 Bayer had more in equity per share than goodwill per share which changed in 2020 due to the legal risk associated with RoundUp! legal claims mainly in USA. Note that the write-off of goodwill in 2020 has an impact both on equity as well as goodwill (a net zero game).

As 2018 shows we see the Monsanto goodwill impact with an all-time high in 2018.

I usually get worried if a company has more in goodwill than equity, goodwill if not real value is a risk factor for owners. It can be easily written down causing huge negative impact to shareholders and increasing the firm specific risk. I still see some risk of goodwill write-owns coming in Bayer's case yet limited in the long run.

Graph shows Bayer AGs equity, goodwill per share an equity ratio

Summary of Bayer AG

Removing the legal reservation and goodwill write-own in 2020, Bayer would have made a more normal net profit of around 4,5 billion euros and an EPS of around 4,59 euros per share. This is however just a simple calculation yet does not display the possible future cost from Monsanto. 

To summarize Bayer, I would not say it is under current circumstances a undervalued company. There are many risk factors associate with Monsanto that can have negative impacts in the future. Once these risk factors are taken care of then Bayer can proceed to making more normal results I would expect the net profit to land around 4 euros per share. Considering this if a bit in the future the current market price is fair.


Saturday, October 2, 2021

Portfolio update September 2021, when there is not enough cash

 In September the market did move up and down as if there is a storm coming and some analyst, influencers and other do think so. They might be right, and they might be wrong, it might be the coming interest rate increases or it might have been Chinese Evergrande crisis causing the fear to rise once more. 

If we look at stock market history, we see a lot of fears and "happy joy joy" moments, some crashes and fast rises. This is normal and nothing to be afraid of, that is my opinion, I sleep like a kitten during turbulent times and dream of buying even more shares as the market crash. That's just me. 

The drop in value did create opportunities for me to increase my positions in companies mentioned below. I did invest more than the two scenarios I created to see if possible to reach the goal of 1 million euro portfolio (link to post here), the yield will be the challenging part, however we shall see what the outcome will be. 

Veolia has a rights issue ongoing to purchase the remaining 70% of Suez in which I will participate, yet only 2 shares will be bought (short post about the acquisition).

The graph below displays portfolio development to long-term goal of 100 000 euro, still a way to go as the market value on September 30 was 55 584,23 euro. During September my portfolio fell below the short-term goal of 55 000 euro market value, yet increased above mainly due to my additional purchases. I did want to buy even more shares in all the below companies and some other yet run out of cash. Will have to wait for the coming dividends as well as next paycheck.

Graph displays my portfolio gap to long-term target of 100 000 eur


Portfolio Changes September

Alibaba (ticker BABA)

Increased my position by 2 shares at $148,90 as the market value dropped, weighted average purchase price decreased from $212,98 to $205,61. I still find Alibaba a good investment in the long run even thought I have heard some negative comments about Alibaba mainly relating to it being under Chinese regulation. The important question to me is, will Alibaba still exist 20 years from now and will they have grown even more and profitable? My opinion is yes, the political risk will not ruin Alibaba so I will hold my position.

Bayer AG (ticker BAYN)

 Increased by 1 share to a total of 38 shares, weighted average purchase price decreased from 61,12€ to 60,76€. Still buying Bayer even if some might have lost hope with all the problems they manage to run into. Bayer has good products that help people and do see a future with Bayer still as a significant player with proper dividends and good growth. 

Telia (ticker TELIA1)

 Bought 30 shares in Telia in the price range of 3,53€ to 3,61€, weighted average purchase price did not move and remained the same at 3,77€ a share. Telias dividend is expected to be paid in beginning of November, will be 1 330 SEK gross and around 1 130,50 SEK net of withholding tax, around 111€. A good contribution and improved reinvestment opportunities.

Telias stock has taken a beating for some years, corruption scandals have hurt Telias reputation. The divestments made might have a positive impact and hope Telias current management is able to improve their reputation and get it on a small growth path.

Dividends

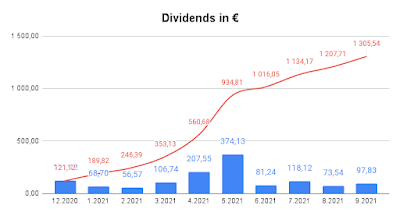
Received a total of 97,83€ in dividends during September, a little more than in June. my position in Pfizer received a full dividend for all 12 share and Wells-Fargo increases their dividend from $0,10 to $0,20. As the graph below displays the biggest dividend months have been April and May, when European companies pay their annual dividends. 

In October there will be a small dividend party as Nordea pays a dividend for 2019 and 2020 as well as Old Republics on-time cash dividend.

Below graph shows the monthly net dividends as well as cumulative net dividends, year to date I have received 1 184,42 euro which is 54% of my short-term goal. The gap will be reduced a bit however not enough to reach the full short-term goal, hopefully next year.

Graph displays my portfolio dividends


Pcture shows my portfolio dividends in September 2021

Saturday, September 25, 2021

Veolia Environnement to acquire Suez

 On 16th of September Veolia Environnement announced their acquisition plan of Suez of the outstanding 70,1% of Suez shares not held by Veolia. This will create a new giant in environmental services like waste management and water. I only own 12 shares in Veolia Environnement meaning the impact to me is small. Link to Veolia Environnements investor page is here. The total acquisition price of Suez will be 9 billion euros, Veolia is striving for annual synergies of 500 million euros split between 100 million the first year and 400 million in the second year.

In order for Veolia to acquire the outstanding 70% of Suez they have launched an rights issue to shareholders. For every 21 rights you have you can acquire 4 shares in Veolia at a price of 22,70€, yet got 14 rights for the 12 shares I have, therefore I would end up with a few right that would not be used and will be worthless unless I sell them or buy more rights. I have decided the use the rights I have, still open if the excess ones will be sold or at some point. 

Veolias share closed at 32,82€ on Friday which would give me a discount of 30% to market price, something very interesting now and could be considered a good discount.

At the same time my portfolios market value has dropped below the short-term goal of 55 000€, 54 842,79€ was the closing value on Friday. A bit below target yet as I have earlier mentioned that is something that will happen from time to time. This is a good opportunity for me to review my portfolio holding, their weights and see what I find valuable to increase my positions in. By default Veolias share of my total portfolio will increase a bit.

This Fall has started with good new in my opinion, Old Republic International with their special, one-time cash dividend and now Veolia will acquire Suez.

Sunday, September 19, 2021

In search for undervalued Swedish stocks

I went on a search for undervalued Swedish stocks and the result was surprising. Based on market valuation 17th of September the Stockholm stock exchange has only 10 low or undervalued stocks, most undervalued stocks according to the screen was in the investment company class. The criteria for being undervalued in this screen was the following

  • P/B- ration less than 3
  • P/B (most recent quarter) less than 2 
  • Trailing 12 months P/E-ratio 0-20
  • ROE over 15%
  • ROA over 10%
  • Gross margin over 40 %
Unsurprisingly the list consisted of investment firms, yet also a goldmine company. Why the list of investment firms was not surprising is partially the high gross and net margin I set. Investment firms usually have high margins until markets turn south, that is when market valuations no longer work in their favor. ROA is also something many industrial companies can have difficulty achieving as their balance sheet consists of many factories, inventories, goodwill and so on. Even though industrial companies should achieve a good return on their assets it might be that they are relatively high priced now.
It is not a surprise we see so few undervalued stocks in Sweden. The market has risen a lot and OMX Stockholm Price index is up over 26% year to date, since 2011 it has risen 242% equivalent to a CAGR of 13 % per year. In other words the broad index has given a good return to investors. But to the topic of undervalued companies..
 
Which companies did show up on the list, let me introduce Stockholms undervalued companies;
  • Investor Ab
  • Kinnevik Ab
  • Bure Equity Ab
  • Creades Ab
  • VNV Global Ab
  • Svolder Ab
  • VEF Ab
  • Ab Traction
  • Kopy Goldfields Ab
  • NAXS Ab
Here I will focus on only six of the ten companies, reason is that all are not interesting for me and primarily want to see what the return would have been if I invested in the company back in the days. Let me start with the biggest and oldest of them all.

Invesor AB is a known Nordic company mainly ruled by Wallenberg family. Investor has investments in many known global companies and some more niche specific and less known companies. The last 10 years Investors A share has risen 558% excluding dividends. A good return if you jumped on the stock back in 2011. If you bought a share back in September 2011 you would have received gross dividends of 23,75 SEK (adjusted for stock splits), almost as much as you would have paid for a share in the company. What might be special with Investor and the Wallenberg family is their investment policy and horizon, they see their investments as almost forever and focus on development and improvements instead of fast gain and splitting companies to quickly realize a short-term profit. 

Kinnevik Ab is an investment company, like many others they provide expertise and possibility to develop companies through the large network they have. The last 10 years the share has returned 526%, still a very good return even though a bit behind Investor Ab. Dividends since 2011 Kinnevik has paid a total of 170,40 SEK including share distributions of investments Kinnevik had. The shares they distributed have been a bit harmful for some owners as it has increased their workload to ensure they claim their right to the shares, example with Zalando. It has also been a bit confusing how to proceed and fulfill your claim for the shares Kinnevik has distributed to you. If we exclude the issues with dividends as shares, one share in Kinnevik would equal a dividend return of 224%, which means a very good total return. 

Bure Equity Ab is also a more normal investment company like Kinnevik and one very small position I have. The share has returned a staggering 1 909% in return over the last 10 years. Dividends it has paid out a total of 12 SEK and is a bit below the price you would have paid back in 2011. Bure Equity Ab is also one of the companies that now in 2021 launched a SPAC on Stockholm's stock exchange. Bure has many investments in for me unknown companies and interestingly they own a railway company, if it does not ring a bell then look at Berkshire Hathaway. Overall the return from Bure as an investment would be terrific in capital terms but not from a dividend perspective. 

Creades AB like Kinnevik and Bure Equity is a normal investment company, yet first trading day was in 2013. If you would have bought a share on the first trading day you would by today have a appreciated value of 689 %, strong growth in other words. From a dividend perspective you would be far behind with only 6,30 SEK in dividend compared to a purchase price of 13,256 SEK. From cash-flow perspective not the best but from a value appreciation perspective a solid return. Creades is also one of the companies that launched a SPAC on Stockholm stock exchange in June 2021. From Creades investments I only recognized one, apotea.se which is a pharmacy company (if you ever look at Swedish TV you eventually will see an apotea.se commercial). 

VNV Global Ab is an unknown investment firm to me, a Swedish mid cap company with an IPO back in 2007 just in time before the financial crisis. Just like the other investment firms VNV Global has many investments in companies I do not know nor have ever heard. Their investment idea seems to be utilizing network effects, assume the idea behind is good and solid as focus seems to be on value appreciation and not that much on cash flow. If you bought one share in VNV Global back in 2011 you would see a nice 1 617% value increase by today, not that bad, yet you would not have received any dividends from the company. From a value perspective the company has managed to show owners a good return in market value, yet the cash flow to investors is still open. 

Svolder Ab is an investment firm that invests in listed mid and small cap companies. Svolder could be seen as a small Investor Ab as they also invest mainly in listed companies. The idea seems to be close to the same with the difference that Svolder focuses on the mid cap and small cap companies that are not subject to a large analytic army. This way they can find value before others, or the market realizes it. One share of Svolder would have returned an awesome 1 208% for 10 years while dividends would account for about 59% of the purchase price. Interestingly Svolder announces NAV (net asset value) of their investments every week. 

Summary

As these firms are undervalued on a few indicators and have high margins I am not that confident they all will be good long run holdings. Gold mines have the issues of dependence on gold price which markets determine, not the company. This means the business is vulnerable and can be volatile, it also has the environmental issue as mines are hardly sustainable nor are they good at managing their waste. 
Investment firms value their holdings at market value, during booming markets it all looks spectacular, but as we saw in Q1 2020 it can rip large holes in their income statement. Investment firms cash flow would be a better option to analyze just as REITs have EPRA and FFO to better reflect the business health. I am not suggesting investment firms should be regulated or required to change reporting, just simply saying that it is strange they do not have a similar cash flow or operational reporting KPI. Operational performance before market valuation could give better indication of the business health.
Assume there is some lobbying behind it and finance has deep pockets, might explain a lot.
 
To shortly reflect the annual growth (CAGR) of stock price of the reviewed companies I could draw some conclusions, but not any final. 
 
Company Stock CAGR %
Investor Ab 21 %
Kinnevik Ab 20 %
Bure Equity Ab 35 %
Creades Ab 29 %
VNV Global Ab 33 %
Svolder Ab 29 %


I am not that interested in the Swedish undervalued firms that the screen gave me. If markets fall rapidly by 20-50% I might take positions in Investor Ab or some other company and do hope that day will come in the nearest future. Was not able to find the market P/E-ratio for Sweden, would however guess it is over 25 as Western markets in general are reflecting a stimulus monetary policy. 


Saturday, September 11, 2021

A review of Alibaba Group

 Since the market value of Alibaba has fallen and I have a decent amount invested in the company, I decided to make a quick review of Alibaba. How does Alibabas financials look like? What is Alibabas political risk? These questions will be answered.

Alibabas Group (ticker BABA) has fallen and shows a decent minus in my portfolio, even though only 14 shares at $216 the unrealized loss would be painful with -21% of invested amount. Link to portfolio page from where you can see the latest market price of Alibaba, its return and weight of my portfolio. 

I do not see any operational changes and I am left pondering is it something wrong with the financials or is it political. There was the sexual assault scandal at Alibaba but would not be surprised if many other big companies have the same issue however are covering it up or handling it better. Sexual harassment or assault in any way or form is not acceptable and do expect Alibaba to take required actions. 

Back to numbers.

Alibabas financials

The numbers are from Alibabas 20-F filings and are all in USD, EPS (earnings per share) are for ADS which is equivalent to 8 ordinary shares. I will quickly start with the balance sheet and then proceed to the income statement and end with some key ratios.  

Balance sheet

Alibabas balance sheet is displayed in the below graph where we see that total assets have grown every year since 2015 while the equity ratio has remained stable. Alibabas equity ratio was at lowest 51% in 2018 and 2019 only to increase to 55% in 2021. This means Alibaba is profitable and reinvesting its earning into the company. It is exceptional that a company growing at this paste would be able to remain the high equity ratio unless it does what Alibaba is doing, reinvesting earnings. In the long run if Alibaba can remain on the same path the company can grow significantly and at some point might be able to declare dividends. 

 Alibabas current ratio has remained good, mostly around 1,90 except 2019 when it temporarily dropped to 1,30. Still good and means the company can handle its short-term obligation without any major problems. A ratio I use to see how fast a company can be debt free is cash to liabilities ratio, basically based on 31 March 2015 annual report Alibaba could have paid all their debt with the cash at hand, making the company debt free. 
Alibabas ROE (return on equity) has been outstanding, even though the company has a high P/B-ratio. The ability to return a high return on equity is important for any company as it states is the management can utilize the assets and cash at hand. Alibabas ROE has been very good.

Income statement

The following two graphs show Alibabas revenue development and net profit development since 2015. We can see that revenue has grown at a huge rate of almost 44% per year until 2021. The graph clearly shows that the growth rate has been above 40% from 2018 meaning Alibaba has been able to grow its revenue over 40% per year for 4 years. This is a huge achievement for any company, as we look further down the net profit has not followed the same growth patter as revenue. As Alibaba develops its operations and invests back in the business, while getting fined by Chinese government we can expect the profitability to rise at a slower paste than revenue.

Graph displays Alibab Group revenue development and revenue compounded growth
In the above graph is Alibaba Groups revenue in million USD per year displayed in blue columns and scale on the left axis while annual compounded revenue growth is the red line and scale on right axis.


The graph below shows how Alibabas net profit has developed since 2015 until 2021. We see a strong growth rate and spike in profitability in 2016 while returning to a more modest growth rate of 28% to 40% between 2017 and 2021. The net profit margin of Alibaba has remained strong of a minimum of 20 % of revenue (2020). A net profit margin of over 20% is very strong for any company, many times banks and financial institutions have a similar strong net profit margin.

Graph displays Alibaba Groups net profit and net profits compounded annual growth
Above graph displays Alibaba Groups net profit in million USD per year in blue columns and scale on the left axis while red line shows the compounded annual growth rate of net profit. 

Alibabas segments

Now Alibaba has four operating segments, core commerce, cloud computing, digital media and entertainment and innovation initiatives. Of the four core commerce is the biggest with almost 87% of the total revenue and the only segment with a positive operating profit and EBITA. Of all the segments Alibaba has I find cloud computing the most interesting one and the one with a huge future potential. Cloud computing covers areas like big data analytics, machine learning, storage and elastic computing. If we look at Alibabas competitors like Amazon and Microsoft, they also have recognized the value of clouds and storage of data which is a big revenue stream for them with a tasty margin. Media and entertainment look interesting and do see it as a challenger to Western as well as locally in Asia as a possible profitable business, it will just take time and a few big hits.

P/E-ratio

Alibabas has a high P/E-ratio of 20,13 given the stock price of $168,10 and the last earnings per share of $8,35. Considering a tech-company and the growth opportunity the ratio is modest yet reflects the political risk associated with Alibaba.

Alibabas financials discussed

 Based on normal financial KPI’s (key performance indicators) Alibaba can be considered a bit expensive. At least P/B- ratio is very high at current market value. However, P/E-ratio is on a more moderate level for a company growing in the same speed. A fact that must be faced is that no company can grow forever and that needs to be considered in Alibabas case. To sum it up I still see Alibaba from a financial perspective a valuable company which will contribute with growth to my portfolio in the long run.

Political risk

Currently the biggest risk with Alibaba would be political or Chinese government in my opinion. The Chinese government has hit hard on different tech companies by adding legislation and forcing reduction of dominant position. This risk is reflected in market value and seems like many are expecting future fines and less profitable business. My opinion is that the market reaction is short sighted, and that Alibaba will recover just like rest of Chinese tech companies. Reason lies in Chinese government not wanting to scare businesses away as it employees and ensures discipline among citizen. If people have a job, they are less eager to rise against authority and governments limiting business loose tax revenue. I see the Chinese government regulation tech companies to ensure nobody gets a monopoly, which is good. Some companies do start with predatory pricing to remove competition only to raise prices afterwards. 

Let us see what the actual outcome of government actions will be and how hard it will hit Alibaba.

Conclusion

My conclusion is that I will not sell my Alibaba shares as I see a good future. There will most likely be days when the market value is below current value of $168,10 and days it is above. The business will continue and they will come up with good future solutions and value generating services for customers. I will continue to hold my shares in Alibaba if the business changes I will have to review it and my position.


Sunday, September 5, 2021

Portfolio Update August 2021

 August was an interesting month, my portfolio value was stable above 55 000 euros which is good from my goal perspective. The increased positions in Bayer AG contributed with better margin to the short-term goal. If markets start to panic then my portfolio will fall below the 55 000 euro threshold, yet in the long run it does not matter that much. 

Focus has lately been to summarize annual reports and find new value opportunities. It has been hard to find value as many companies are valued at high multiples, meaning a long payback period.

I mentioned in my last portfolio update from July that I might consider liquidating some positions. I am still weighting the benefits and costs from having these positions and if some would be liquidated and funds used to increase other positions. The issue I am facing is when to sell and at what price, probably one of the most difficult questions ever in investing. For example, if I would have had some GameStop shares when the stock started to fly I would have exited it way below its high at $483, most likely bought around $2 and sold at $10.

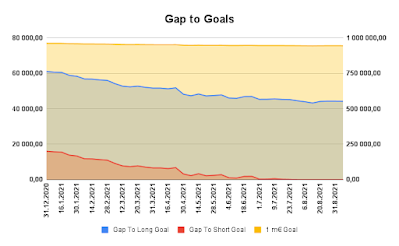
Graph below displays gap to goals in portfolio value. Left axis is for short and long-term goal while right axis is to the ultimate 1-million-euro goal. As you can see the gap to short-term goal is zero.

My portfolios gap to goals
Markets were behaving interestingly in August, Corona cases, interest rates, employment numbers and inflation pressure has caused some headaches to many. Especially inflation pressure has been a hot topic for a while, and I do see prices rising. Question is then, will prices rise and keep on rising to a extent that forces Central Banks to raise interest rates? It might happen, especially in the USA however Euro area seem to be struggling in different ways that might postpone rate hikes.
Taliban's taking over Afghanistan did seem to impact markets for a second only to be forgotten due to limited impact on global economy. We saw new all-time highs for some indexes, partially supported by low interest rates and good Q2 results but also future expectations.

Portfolio Changes

Small changes during August as still awaiting better moments to increase my positions in a few companies. Was also a bit short on cash at hand which limited the possibility to buy more stocks. In total I purchased shares for 285,64€ in August which is a small amount.  

Alibaba (ticker BABA)

Weighted average purchase price decreased from $216,68 to $212,98 as one share was bought for $159,50, not the best price in August but of value for me. Alibaba has been hit by a lot of challenges, Chinese government, sexual scandal and challenges with US Securities and Exchange Commission. As I have been increasing my position it might be a clear statement that I still believe the value of Alibaba to increase over time. I do see more value in Alibaba then many hype stocks as they have more tangible services and products and are not dependent on hypothetical future development.

Bayer (ticker BAYN)

Bought 3 shares of Bayer AG during August, main reason is that I still expect its future to be brighter than what we currently see. As the legal claims regarding Roundup! and Monsanto acquisition will dissappere the future of Bayer will be brighter and earnings stronger. The weighted average purchase price decreased from 62,14€ to 61,12€ per share. Still a way to go when market closed at 47,20€ on Friday September 3rd. If I would have a average price around 50€ per share I would be happy so will most likely continue to buy more.

Dividends 

In August I received 73,54€ in net dividends and on a year-to-date basis 1 086,59€ in net dividends. Still far from 2 200€ which is my short-term goal, as the portfolio is being built up on a long-term basis (including taking advantage of any short-term bargains) it might be that the dividend goal will not be reached next year. 

 The graph below displays monthly dividends (blue staples) and cumulative dividends from start (red line).

Portfolio dividends since start

Regarding the dividends, note that AT&T dividend does not reflect the full position of 121 shares as 5 shares were acquired after ex-dividend date. AT&T has also the split of WarnerMedia to come which based on statements will reduce the dividend by around 50%. This will have a negative impact on dividends unless Warner Bros Discovery can compensate. Do see it a bit challenged as Discovery has not paid any dividends on common stock for some time.

Portfolio dividend specification received in August 2021


Saturday, August 21, 2021

Positive surprise from Old Republic International

 Old Republic International has again surprised its owners with a special one-time dividend of $1,50 per share, payable to shareholders on October 6th 2021 with a ex-dividend date of 14th September 2021. For me this means an additional dividend of $105 gross dividend and $89,25 net of withholding tax. 

This is good news for shareholders and my short-term dividend goal of 2 200€ per year. I am still behind on my dividend goal, however Old Republics additional dividend can boost my investments a bit to ensure I should achieve the goal 2022, well ahead of the set deadline 2025. 

One challenge I find with the one-time special dividend from Old Republic is the challenge to find companies that pay a good dividend (dividend rate = dividend / stock price). For me it looks like the Board of Old Republic has the same issue, they see there is a challenge to find good investments and have therefore decided to distribute additional cash to shareholders. This is a very good practice from the Board and Managers, and I appreciate them for it. The way they work seems to be close to Warren Buffett's and Charlie Mungers principles, if you do not find good alternatives for your excess cash then distribute it to shareholders or buy back your share (Berkshire Hathaway has bought back B shares for some time now). There is a difference as Berkshire Hathaway had approximately 39 billion USD in cash and 102 billion USD in short term US treasury bills, equivalent to 141 billion USD in cash per 30th June 2021 (about 15% of total assets).

Now I face the challenge to find one or a few investments for the dividend, I do have some in mind which will show up in November once I update my portfolio. I will still follow my normal investment principle, by looking at my older posts you might figure out what I will do. 

Overall good news for Old Republic International shareholders and hopefully the company can continue to delivery good returns in the future.

Friday, August 13, 2021

A review of Nokia; The Rise, Fall and "Rise" of a Tech Giant

The first company I will review is technology giant Nokia. A lot has been said about Nokia, from praised to almost hated by some. Many made money and a lot lost when IT-bubble burst back in 2000. If you owned Nokia options and sold them at the right time you did make a lot of money in a short period.

The setup is Nokias history followed by biggest mergers & acquisitions, after that we will touch the financials for last 18 years and look at if you should have been an owner versus Nokia manager or board member. Before summarizing the post, I will display how I made a little of money of Nokia stock, a few old trades. 

Nokias History, From a Paper Mill to Tech Giant

Nokia has a long history, and it might surprise you that Nokia started as a paper mill in 1865. In 1898 Finnish Rubber Works was established followed by introduction of electricity in Finland, a company named Finnish Cable Work was established in 1912. These three companies were merged into one in 1966, the new company name was Nokia. During this time Nokia was in several industries, integrated cable, electronics, tires and rubber footwear. 

In 1979 Nokia and Salora founded a joint venture called Mobira (derived from mobile and radiophone) which focused on developing what was then called radio phones.

Since 1990 Nokia recognized the potential in mobile phones and started heavily investing and developing phones. Nokia got some publicity when Mihail Gorbachev called his communication minister from a Mobiara phone in 1989. After this the phones started to develop in a very fast paste, 2004 Nokia launched its first touchscreen phone, the Nokia 7710.

In Q4 2004 Nokia had a 34% market share of shipped phones, equivalent to about 66 million, only to sell about 3,8 million in Q3 2019. Today Nokia has a licensing agreement with HMD Global to manufacture Nokia phones, number of phones are not on the same level as during the hay days.

What also needs to be highlighted is the number of companies that today are listed or part of another company and once were a part of Nokia. Examples like Airam, Nokian Tyres, Essity (soft tissue division), PKC Group, Kemira Chemicals (part of Kemira group) and Grid Solutions (part of General Electric Grid Solutions). Nokia has been listed at Helsinki Stock Exchange since 1912 and in New York since 1994. If you would have received the shares in these companies you most likely would not have to work today (for the fire people).

Biggest Acquisitions & Divestments

Nokia has made a lot of acquisitions and divestments over the years, therefore we shall focus on the main acquisitions and divestments. You can have a closer look at smaller acquisitions and divestments on Nokias website.

The company has many big leaps over the years, from a papermill to dominant phone maker ending up as a network company today. Looking a bit closer at acquisitions and sold divisions we see a lot of interesting moves. One of the biggest acquisitions was Alcatel-Lucent back in 2015 for 15,66 billion EUR (announced April 15, 2015), which apparently has not delivered the promised synergies. 

2014 The big move

On April 25th 2014 Nokia sold its Devices and Services (mobile phones) unit to Microsoft in for 5,44 billion EUR, a really good price considering what market share Nokia phones had at that time. Eventually Microsoft did not see any use of the mobile devices purchased from Nokia.

2015 Maps out, France in

HERE was sold at the end of 2015 for 2,55 billion euros to Audi, BMW and Daimler (maker of Mercedes cars), HERE was Nokias mapping, navigation and location program

15 April 2015 Nokia announced its acquisition of Alcatel-Lucent at a cost of 15,6 billion euros, the acquisition was made as an all-share acquisition while Nokias share was at 7,77€. As stated on the press release, they targeted a reduced interest expenses by 200 million a year and 900 million euros in operating synergies, sales would land at 25,9 billion euros. Maybe some of the targets were met however they need to pick up on sales and profitability.

Nokia Financials and Dividends, From Good to Disastrous to what is wrong with this company bathing in cash?

In this section we look at Nokias financials and compare who the winner in the company is, is it the Board of Directors, Management Team or Shareholders who have gained the most. A big NOTE, only IFRS numbers have been gathered and each years numbers are according to that years annual report published on Nokias investors page. Do not look at the non-IFRS numbers as by now people should have learned, that is why Risto Siilasmaa was fired, apologies he was escorted out or requested to leave...

On October 24th 2019 Nokias Board of Directors decided not to continue distributing any dividends, discontinued the dividend, reasons were

  1. Guarantee increase of 5G investments 
  2. Guarantee Nokias cash position
  3. Continue investing in growth in strategic areas such as enterprise and software

This decision frees up time and pressure from both Board Members and Management Team, if there is no pressure to deliver then time for laziness will proceed. 

On December 3rd 2019 Chairman of the Board Risto Silasmaa "resigned " after it was clear the board was looking at wrong numbers. It also weakened ex-CEO Rajev Suris position. Questioning internal reporting and reliability of numbers. What needs to be stated is the use of non-IFRS numbers in Nokias reporting. Sari Baldauf will continue as the new Chairman of Nokia from start of annual general meeting in 2020.

My question is therefore, how much value if any has the management group and the board of directors created for shareholders versus how much have they earned during the same period? 

This is a simplified question and example, yet one I have not heard anyone ask as it is sensitive. Question is also raised as my opinion is not to reward bad performance with perks, salary and fat bonus, that’s what I call skewed rewarding. 

When reading Nokia's annual reports it is a bit confusing what has actually been the total compensation to Management Team in shares and in base salary and other compensations. They have partially separated the President and CEOs salary and partially bulked together share compensation with the rest of the Management Team. The main issue I find in Nokias reporting set up is the unclarity in management compensation, fortunately Board of Directors compensations are the only clear and detailed information you get (except for 2016 and 2015). Guess shareholder are seen as second-class people based on Nokias reporting standards. 

Below are some of Nokias numbers summarized. Equity per share (excl. non-controlling interest), ROE (return on equity) and cash & cash equivalents per share. Equity per share has dropped due to poor performance while cash per share has increased coming from sales of business, mainly mobile devices. ROE swings a lot due to the volatile performance. What we can see is the impact from iPhone hitting Nokias profitability starting in 2007. Since iPhone was launched, we can roughly state that Nokia has not been profitable except when selling businesses. I would assume Samsung with their Galaxy models also destroyed Nokias phones. If I was a Nokia shareholder I would be worried that the company has not been profitable since 2007. This means the company has issues it needs to fix as soon as possible. Would also demand the Alcatel-Lucent synergies to be better highlighted and if there are none (which it looks like), then admit it has been a failure from some perspective.

Below we see R&D expenses (impacting income statement), retained earnings and cash & cash equivalents. An argument why Nokia should not pay a dividend could be the negative retained earnings. This argument is valid, however with over 6 billion euros in cash you can distribute some of it to shareholders without risking the whole company. Earlir stated the increased 5G investments are a little confusing, they had sold 5G already so why do they need to invest more in a product they already have made and does it really cost that much?


Owners Return

One note, the result may and will vary depending on which period is chosen. I chose the period end December 2004 to October 2020 as I wanted to display the long run return to shareholders and reduce the impact from overvalued periods such as the IT-bubble. I personally bought shares back in 2013 and 2019 only to sell them within the same year. Have to say it was profitable and a short-term investors wet dream. 

In order to give some examples on what return you as a shareholder have received, I have chosen two different dates, just for fun. The first date is 3 September 2013, as BBC had an article "Nokia: The rise and fall of a mobile giant", the stock opened at 4,36€ and closed at 3,97€. I will pick a stock price in between, 4,16€ shall do for this example. For the second date we will go further back, all the way to 2004, December 15th 2004 Financial Times article named "Nokia Bounces Back In Mobile Phone Sales", on this date the stock was at a high of 11,90€ and low of 11,71€, closing at 11,71€. Would say that based on the article by Financial Times some might have bought for say 11,89€ a share. We will go with the 11,89€ price per share. 


As the graph shows just holding Nokia stock since 2004 would have been a bad investment and result in a loss up to 70 % of your investment while investing in 2013 resulted in -13%. Taking into account received dividends the result has been a bit different, the 2004 investment would still be at around -66% while 2013 would show a gain of 16% (before tax and not reinvested). Dividends since 2004 would total 4,29€ gross and 1,23€ if you invested in 2013. Note 2003 result dividends were paid in 2004 and so on.


If you bought back in 2004 you had a chance to temporarily exit at around 28,60€ on November 6th 2007, only to buy it back 2008. This way you would still be on the profitable side even though the share price has declined a lot. Note that Apple launched iPhone back in January 9th 2007. 

If you sat on the board of Nokia or was one of the members in the management team you would be in a better situation. Management Team compensation in MEUR can be seen on the left axis and Board compensation on the right axis. As we see management team has partially compensation linked to the result while the board has seen a steady increase while the company has underperformed. I know many argue you must pay to get the best. I disagree with that statement, the best is not driven solely by money, but by the chance to make an impact and improve. It gives them pride and acknowledgement. The ones driven by money will only try to maximize their share whatever the cost, and that price is for the shareholders to pay. Here Nokia seems to be a good example. I do conclude it has been better to sit on the Board or in the management team of Nokia then to be a shareholder. We also have to note that the numbers given are absolute and not per person adjusted. Per person adjusted could give a better picture and there the board members have seen a compensation increase of almost 3,9% per year (2012 to 2019 as 2020 isimpacted by one small meeting fee). Not bad compensation increase given the performance. The management team has more volatile salary as they have more result oriented compensation. On average they have seen an increase of 7,6% per year (2012 to 2019) and 5,9% until 2020. 2020 is a bad comparison year due to change of CEO.

(On left Y-axis is the management team compensation in m€ while the right hand side represents the boards compensation in m€).

How I Traded Nokia Shares

First short-term trade was back in 2013. Bought in the beginning of the year and sold the shares at the end for a small profit. Sheet displays transactions made in 2013 with a small profit of 215,43€ or 34,32% before tax, after tax the profit was 150,80€ or 24,02% (30% tax rate on capital gains). Nokia did not pay any dividends during this period, dividend of 0,37€ was paid in July 2014.

My second trade was done in 2019 with a much smaller return as I found better investments and did not want to wait for the stock to rise. As you can see it was done in a short period from beginning of October 2019 to 11th of October. A gross profit of 0,87€ or 0,84% was made, equivalent to 0,609€ or 0,588%, considering the short period of the trade could be duplicated through the year a proper return would be made.


How could Nokia contribute with value?

Share buyback programs and reducing the amount of shares outstanding and in treasury to the extent necessary in order to still compensate board members and management team when performance is acceptable or better. This is possible as Nokia has cash, they also have short term investments that have performed poorly. Owners of Nokia would have received a better return by investing the amount in an index fund. Opportunity cost should be highlighted here. The board should be able to identify if shareholders can get a better gain somewhere else, then they should distribute the excess capital and let shareholders decide what to do, not the other way around.

These are good options for Nokias management to do their job and increase shareholder value. That is their job and that is why they are paid a lot of money, receive shares and other perks, therefore owners can demand some return. In Nokias defence they have had share buyback programs, however small and not removed most the shares. This action is not value creation, more own reward insurance. 

One additional point, 6billion euros in cash & cash equivalents is too much for a company like Nokia (Ericsson has about 3-4 billion euros in cash and has paid a dividend). It makes the management and board sloppy and slow. Comparable companies do not have that much cash and most perform better than Nokia. Maybe something for Nokias board to consider in their next meeting.

Conclusion

Nokia has lost much of owner equity with poor performance over the years and failed to convince all investors and owners. Usually it has been a serial disappointer, with some analysts focusing only on non-IFRS numbers which turned out to be a mistake. Since 2003 a Nokia owner has lost equity due to increased number of shares as well as earlier mentioned, poor performance. The equity change is smaller than the loss from market price which might hurt more. Out of 18 last years Nokia has made a loss in seven of them (2003 to 2020). If I would invest on average 4,4 billion in R&D every year, I would demand a better result than Nokia has contributed.

My own opinion about Nokia is this, for the long run it still is a poor company failing to deliver owner value yet for short term gains it is a good option. Many have made money on Nokia and many have lost a lot, focusing on the last 18 years Nokia has failed to deliver. We shall see if the new CEO Pekka Lundmark can change it for better...

I do not hold any Nokia shares at the moment, I might take short-term long positions (buy shares) in the company if I find the market price undervalued.


Saturday, July 31, 2021

Portfolio Update July 2021

 During July I increased my positions a bit as all dividends were reinvested. Bought shares in AT&T, Bayer and Alibaba while wondering if any position should be decreased or liquidated. Companies or mutual funds on reduction or liquidation list is Handelsbanken Latin Amerika, DigitalBridge Group and Ventas. Made net investments, meaning I bought more than my portfolio received in cash inflow (dividends and cash from sales). Haven't been that lazy investor lately even though mainly bought companies I already have and which market value is below purchase price. For me the laziness comes from not buying and selling all the time, instead as many times mentioned, looking for value now and not worrying to much about the future.

July was interesting as on Monday 19th global stock markets dropped around 2%. Which is a big movement, I was on the buying side that day covering the pessimistic market. Bought AT&T and Bayer AG however not at their bottom. Afterwards I was disappointed of only being able to invest a small amount. Would like to have at least ten times the money to invest every month.

My Summer holiday started in July with two weeks off, will continue with two weeks end of August. Sunshine and increasing covid-19 cases was the topic of my holiday. Have people not learned anything in the last 12 months? If they just could use a mask and take care of their hygiene, we would be in a better situation today. It did not ruin my holiday or hotel stay but has made me a bit frustrated as every day you see people neglect any form of common sense.

Holiday also started with some additions to my wardrobe, did spend a lot on clothes, almost 500€ in total on a pair of shoes, pants, shirts and jackets. Lloyd shoes and Oscar Jacobsen jackets do have a fat normal price so did what I usually do, buy at discounts and off-season. 

Also spotted that I had forgotten to update my Kone Oyj position, bough one additional share back in May for 65,75€ including transaction costs. Small change yet does impact how much I have left to reach my goals. 

The portfolio return was a bit of due to the swings in currencies, have made some adjustments that will correct for the currency swings to show a more accurate and realistic return. It also corrects the currency impact in invested capital. Return is calculated on EUR basis which is impacted by current market exchange rates as well as market prices in all portfolio currencies. 

Portfolio value at end of July was 55 492,08€ or $58 513,84, have reached my short-term goal in market value however in dividends I am still behind. A short celebration of achieving one of the short-term goals this fast (mainly driven by investments). Now just focus on the dividend part as well as the long-term goal and eventually the 1-million-euro goal (once 1 million is achieve the next step might be a 5-million-euro portfolio). 


Portfolio Changes

Alibaba (ticker BABA)

 Increased my position in Alibaba as the price has been lower than my weighted average. Bought 5 shares and have now 14 shares in Alibaba for an price of $216,68 per share. The 5 shares were bought at $200,99 (weighted average), ranging from $209 to $191 per share. 

Main reason for the volatility is the tension between China and USA, Chinese Governments need to show its power over tech companies and US authorities demanding Chinese companies listed on their exchange to follow rules. There is nothing wrong with Alibaba, instead it is the political risk reflected in the price. Compared to Amazon which has less political risk now while higher legal risk. For me the swings are more of a opportunity to add to my position, do not see a huge risk here. Did quickly read Alibaba's annual report and did not see any big surprises or anything that worried.

 AT&T (ticker T)

Bought 4 AT&T shares in July, increasing my position from 117 to 121 shares. Weighted paid price per share decreased a bit from $30,87 to $30,79 as the four shares were bought at a price below $29 a share.

The stock price did fall below $28 after mid-July, however only bought one share… It seemed like the stock dropped after the Q2 earnings report was released and disappointments were revealed from subscription services. Apparently, Netflix lost a lot of subscribers as well. Should be logical if people only used it during lockdown and now are partially returning to their daily life or just want to do something else.

Bayer AG (ticker BAYN)

Increased my holding in Bayer by 13% or 4 shares from 30 to 34 shares. Price paid decreased a bit from 63,69€ to 62,14€. The increase was made before the latest announcement of an additional reserve impacting the result due to legal matter in US (Monsanto acquisition and Roundup products).

Did read Bayers 2020 annual report and it was represented by acquisition failure. I am thinking about Monsanto which Bayer acquired in 2018. Both the Bayer Board and Management Group has most likely lost more of shareholders money than any other legal entity (without going bankrupt). A loss of over 10€ per share, dragging down the profitable segments of Bayer. 

It seems like Roundup has become a chronic migraine for Bayer shareholders. $63 billion is what Bayer shareholders paid for Monsanto and in addition received legal costs and settlements to come and a write down of $10,9 billion. at least $73 billion has the Bayer Management team and Board of Directors caused in cost for Bayer shareholders so far, assume the payback time is more than their combined life expectancy. Let's hope they do not repeat a similar failure in the future unless they do a similar write off their salary and bonus. Yes, I am frustrated about the whole case and would fire the whole management team and ensure the board members are never again re-elected. These kinds of mistakes are hardly treated as they should be, financial damage caused due to neglect and sloppy work usually end in unemployment. Apparently once you get to the management team your failures result in reduction of normal staff while you get a bonus for bad performance. Does sound like the incentive system and responsibilities are far from aligned...

Dividends

In July I got 128,39 euros in gross dividends and net 118,12 euros. From a dividend perspective July was an uneventful month while waiting for beginning of August when AT&T dividend will be booked. Biggest single dividend came from GlaxoSmithKline with net 50,90€ or 43 % of total dividends. Kimberly-Clark was the second biggest payer with 17,06€ or 14,44% and third came iShares Asia Pacific Dividend ETF with 16,41€ or 13,89% of total dividends. Still small amounts coming in every month.


Struggling to see the possibility of dividends reaching 2 200€ this year, Telias second dividend at the end of October will be 1 300 SEK or around 128€ gross and around 109€ net of withholding tax. That will be one of the single biggest dividends coming in. To reach the 2 200€ dividend goal this year I should invest more heavily in companies that will pay the second half of their dividend this Fall or has at least one dividend payments left. This way I could maximize dividend return, problem is that companies tend to see their price increase before the ex-dividend date meaning the return drops. Lower return means you must buy more to get a significant amount in dividends. I have a tight budget, long-term goal and might therefore do more investments based on longer perspective and not the short-term 1 additional percent gain here or there with a 30% risk (poor risk adjusted return). It does explain my increased AT&T and Bayer position.

Just to make my point, I would need to have a portfolio value of around 61 000 euro with a 3,6% net dividend return to achieve the goal of 2 200€ in net dividends. Notably Alibaba and DigitalBrigde does not pay a dividend which raises the total required invested amount. Looking forward to a cooler August month and hopefully some good discounts in the market.

First company review will be published soon. Just need to finalize a few calculations.


Sunday, July 4, 2021

Portfolio Update June 2021 with increased AT&T position

 June was an interesting month as markets are again worried about future interest rates and questions about market valuations has been seen in news. S&P 500 index made a new all-time high, markets are generally showing the increased flow of money pressuring prices higher. This is good for many people as they feel richer. New market highs are not that interesting for me, instead it limits my opportunities to find good companies at attractive or so-and-so prices. I do prefer to pay a reasonable price for a good company than a huge premium which will take a lifetime to get back. 

My portfolio and general market

My stock portfolio (only stocks) has a value of 52 521,62€ or $55 106,92 while my mutual funds have a value of 347,84€ or $411,75 and ETFs are valued at 1 836,79€ or $2 174,27. Total value of my investment portfolio is then 54 706,25€ or $57 692,94. Not a long way to my short-term goal in market value, yet dividends are behind schedule. This is not a full dividend portfolio as it combines index funds and mutual funds representing around 0,6% of total portfolio. My portfolio five largest holdings are (1 July 2021);

  1. Telia Company 8,84%
  2. Nordea 8,38%
  3. Basf 6,78%
  4. 3M 6,46%
  5. Kraft Heinz 6,38%  

Of the top five holdings Telia and Kraft Heinz market value is still below acquisition price, even though Telia has reduced the gap significantly compared to beginning of 2021. As you can see the top five holdings represent 36,84% of my total portfolio which some would say is a badly diversified portfolio. As you might know, my goal is not to diversify, but to choose good companies that will return a decent profit in the long run. 

My stock portfolio gap to long term target and development

There is still a long way to my 2061 goal of a million-euro portfolio and dividends of 55 000 euro. As markets move higher, I usually get less encouraged to invest, this has bothered me, but worked well to reduce any major losses. 

my stock portfolio return since start, inception

Talks about inflation and economic data from U.S.A. as well as minor inflation in Europe might be a sign of interest rates rising in the future. This would move money from stocks to bonds as investors need compensation for bearing the extra stock risk. I would like to see interest rates rise, as we might see some small turmoil in markets which is equivalent to opportunities. What the outcome will be and will we ever see interest rates of 5% in the future is more speculation. 

Portfolio Changes

No special changes made to my investment portfolio during June, as you can see below AT&T is again one company, I have increased my position in. Made net investments of 259,89€ in June (net of net dividends) as I have difficulties finding good companies at bargain or so-and-so prices. Hopefully the prices will come down at some point. I you look at my portfolio you will see some holding with a negative return now. I will not buy them as I see they could come down a bit more and some might actually have bought limit orders open as I am writing this post.

AT&T (ticker: T)

Increased my position in AT&T with 14 shares at a total cost of 341,13€ or $408,54. Weighted average purchase price for AT&T position as a result decreased from $31,10 to $30,87.

I know many are criticizing AT&T for the coming dividend cut. For me it does not have a significant impact as most likely I will still get over 3,5% dividend yield and have shares in WarnerMedia. Hopefully WarnerMedia will pay a dividend compensating for the difference to current AT&T dividend. 

Apparently I have bought 37 shares in AT&T since start of 2021 for $1 083,99 or $29,30 per share. AT&T has paid me dividends of 63,88€ during 2021 which will drop once they cut their dividend in half. I hope the new combined WarnerMedia and Discovery (Warner Bros Discovery) will start paying a dividend in 2022. Discovery has apparently not paid dividend to common stockholders for a while, which does annoy me as I like companies that can generate some cash flow to owners.

Dividends

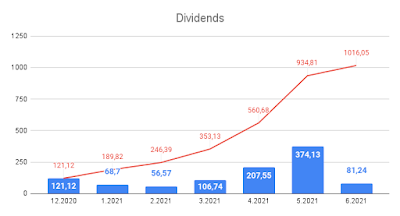
Gross dividends in June were 97,44€ and net of tax 81,24€. Compared to earlier months it is in the same range as February and March while May was exceptionally good due to annual dividends from European stocks. One factor impacting June dividends is that some companies who usually paid in June have now paid the dividend in July (or at least booked in July to my account). The impact is small however still the development would look better given they would have been booked in June.

The below graph displays dividend development since December 2020. During 2021 I have received 894,93€ in net dividends. Which is far away from my goal of 2 200€ at a market valuation of 55 000€, my portfolio value is close to the target while dividends are falling behind. One big question is when will banks be able to open their dividend flow to owners, if it will start in September then my dividends this year might come close to the target of 2 200€. Nordea has only paid a fraction of planned and Wells-Fargo still paid only $0,10 while they back in May 2020 paid $0,51 which would be a big increase to current low level. 

My portfolio dividends in June 2021

My portfolio dividends since start

Enjoy the summer and will try to have my first company analysis done by end of July.

Tuesday, June 29, 2021

Deep Dive into ESG investing, mutual funds and ETFs

In this post I will dive into the World of ESG investing (sustainable investing), I will start with a quick explanation what ESG is and then list funds and ETFs I found. Kindly note that ESG funds are being created or old funds converted to ESG funds at a speed nobody can follow in their spare time. 

What is ESG?

ESG stands for environment, social and governance. ESG measurment means a company is rated on non-financial metrics instead of financial. The topic has been trending for a while as environmental topics have been lifted up as important. ESG investing is a recent investing trend, a form of highlighting sustainable investing and a way for investors to express their opinion.

ESG investing in ETFs and mutual funds

A few ESG investment funds will be mentioned in this post and key information given. There are a few different ESG investment funds on the market, ETFs as well as mutual funds. Issue here is that some funds seek based on specific ESG citeria, others have less weight in low rated companies and other seem to be impacting.

A list of ESG funds and ETFs

Here I have listed funds launched by known banks and investment firms like Blacrock and Vanguard, which have launched their special ESG ETFs that follow specific ESG indexes. I have summarized the most relevant information about the ESG ETFs I found, link to homepage or search page for funds and for more information is given for each. Note that all of the given ETFs might not be available in you country or the broker you use. Note that all information is gathered based on data available 30th May 2021 and that all suppliers are not mentioned due to limited time and reduce your time spent here.

Blackrock and iShares

 Blackrock is known for their iShares ETFs which are most likely known all around the World, some have small charges other are a little more expensive per year. As you can see from my portfolio I do have some iShares ETFs. I will focus on Blackrocks ESG Screened, ESG Aware and ESG Advanced equity ETFs in this section. They do have other sustainability funds available which you can find on their webpage. For example the iShares Global Clean Energy ETF I owned at one point does not show up on the list when I looked at it.

This link will take you to the main page for sustainable investing as direct links might not work perfectly.

ESG Screened

 Screened funds aim to remove exposures to certain businessess that might be controversial or impose risks to investors preferences. 

iShares ESG Screened S&P 500 ETF (Bloomberg ticker: SP5ESUT)

Benchmark index is S&P 500 Sustainability Screened Index with ongoing charges of 0,08% per year and 2,2 million shares outstanding. It pays a quarterly dividend based on history and has 454 holdings. Six biggest holdings are Apple, Microsoft, Amazon, Facebook and Alphabet Class A and C shares representing 22,91% of portfolio. Interestingly on seventh place comes Berkshire Hathaway class B share, note that Berkshire Hathaway has decided not to make any additional sustainability reports and employer responsibility reports. In other words, they do not employ any additional reporting moving against the general trend.

Quickly reviewing the holdings, it looks like the S&P 500 index companies without companies like Exxon and Chervon.

iShares ESG Screened S&P Mid-Cap ETF (Bloomberg ticker: SP4ESUT)

Benchmark index is S&P MidCap 400 Sustainability Screened Index, the fund was launched in September 2020 with 800 thousand shares outstanding and 368 holding. The ETF has annual fees of 0,12% and seems to apply quarterly distributions of funds. Six biggest holdings are Bio Techne, XPO Logistics, Fair Isaac, Molina Healthcare, Signature Bank and Cognex representing 4,03% of portfolio. Here we see that the largest companies have small portions of the total portfolio which can be seen as a positive sign compared to many other funds were the six largest holdings can represent over 20% of the portfolio having a big impact on both upside as well as downside.

iShares ESG Screened S&P Small-Cap ETF (Bloomberg ticker: SP6ESUT)

Launched in September 2020 with 250 thousand outstanding share and annual charges of 0,12 %, this fund has 638 holdings. As the two other ESG Screened ETFs this also seems to follow the same distribution logic of quarterly distributions. Benchmark index is S&P SmallCap 600 Sustainability Screened Index which explains the amount of holding in the fund. Six biggest holdings are BLK Cash Fund Treasury, GameStop class A, Crocs, SAIA, Omnicell and Macys representing 5,55% of the total portfolio. As before we see that the number of holding in the fund reduces exposure to one specific company in this fund as well. Interestingly the fund holds swaps in a few stocks while the two other funds do not, this is one fundamental difference between the tree funds. 

 ESG Aware

The aware funds are supposed to strive for sustainable outcome yet still returning the market outcome. 

iShares ESG Aware MSCI USA ETF (Bloomberg ticker: GU719471)

Launched in end of 2016 with 180,7 million shares outstanding this ETF has ongoing charges of 0,10% per year. It has an MSCI ESG rating of A (AAA is the best rating) which seems to be due to military technology. Notably the fund holds positions in Exxon Mobile (0,62% of the portfolio) and Chevron (0,51% of the portfolio) which might explain why it is called Aware. The ETF has 351 holdings and has been paying quarterly dividends. The ETF follows MSCI USA Extended ESG Focus Index and the six biggest holdings are Apple, Microsoft, Amazon, Facebook and Alphabet representing 19,56% of the total portfolio.

Compared it quickly to iShares MSCI USA UCITS ETF which has a bit higher ongoing charges of 0,33% and has a little bigger weight in Exxon Mobile of 0,65% and Chevron of 0,53% they do look alike to a large extent. Just wondering why, the Aware ETF has lower charges then the normal accumulating ETF, maybe it is due to no mentioning of rebalancing in the Aware ETF which lowers costs.

iShares ESG Aware MSCI EAFE ETF (Bloomberg ticker: NU719472)

 Launched in mid-2016 with ongoing charges of 0,20% and MSCI EAFE Extended ESG Focus Index as benchmark index. It pays a quarterly distribution, has 72,1 million shares outstanding and consists of 482 holdings. Six biggest holdings are Nestle, ASML Holding, Roche Holding, LVMH, Novartis and Toyota Motor representing 8,6% of the total portfolio. This fund is a bit more geographically diversified in the sense of where the stocks are traded compared to the USA fund (obviously). The six biggest holdings have a significantly lower weight then in USA fund and has a better MSCI ESG rating of AA compared to A in the USA fund. The fund is focused on Europe, Asia and Australia based on company trading location and geographical distribution.

iShares ESG Aware MSCI EM ETF (Bloomberg ticker: NU719473)

 This ETF was also launched in mid-2016 and has 168,9 million shares outstanding with ongoing charges of 0,25% per year. The ETF pays quarterly dividends and has 357 number of holdings with a MSCI ESG rating of AA with MSCI Emerging Markets Extended ESG Focus Index as benchmark index. It as you might have guessed invests in emerging markets as the six biggest holdings are Taiwan Semiconductor Manufacturing, Tencent Holdings, Samsung Electronics, Alibaba Group, Meituna and Naspers Limited representing 22,77% of the total portfolio. The fund does have exposure to Russian NK Lukoil and interestingly has Greek Organisation of Football Prognostics (gambling company) as an investment of 0,28%. 

Gambling and oil might not be the best assets in a responsible fund, even though a gambling company would report all necessary ESG material it should be considered most likely not good practice. Oil companies such as Exxon and Chevron can change their energy sources after time, but a gambling company cannot change to more sustainable gambling methods.

ESG Advanced

 As with the other ESG ETF there are also 3 equity focused funds in the advanced portfolio as well as two bond ETFs not covered in this post. The aim of the advanced funds is to prioritize highly rated ESG companies and leaving the rest out.

iShares ESG Advanced MSCI USA ETF (Bloomberg ticker: GU729302)

 Launched in mid of 2020 with 6,35 million shares outstanding and an ongoing yearly expense of 0,10% it follows the MSCI USA Choice ESG Screened Index. The ETF has 320 number of holdings and MSCI ESG rating of AA with six largest holding being Tesla, NIVIDA, Visa, Home Depot, Mastercard and Paypal Holding representing 15,16% of the total portfolio. 

Vanguard

Have two Vanguard ESG ETFs summarized here and to a large extent they follow the same pattern as other ESG ETFs in portfolio holdings.

 Vanguard ESG U.S. Stock ETF (ESGV)

The ETF follows FTSE US All Cap Choice Index and has ongoing charges of 0,12% which is normal for a replicating index ETF. The ETF was launch back in September 2018 and contains 1 465 stocks which is a well-diversified portfolio already. Six biggest holdings are Apple, Microsoft, Amazon, Alphabet, Facebook and Tesla. The six largest holdings represent 23% of the portfolio, reversing my claim of a well-diversified portfolio. Here we see a big exposure to a few companies which means there are a lot of small holdings.

Vanguard ESG International Stock ETF (VSGX)

This ETF tracks the FTSE Global All Cap excluding US Choice Index and has ongoing charges of 0,15% per year. Launched back in September 2018 with 4 913 stocks and six biggest holdings of Taiwan Semiconductor Manufacturing Co, Tencent Holdings, Alibaba Group Holding, Samsung Electronics, Nestle and ASML Holding which represent 10,1% of portfolio. This ETF can be called diversified due to the limited exposure to the six biggest holdings and 10 largest holdings represented 13,3% of the total portfolio end of April 2021. A diversified portfolio at reasonable costs would be available here, might consider this fund if the market turns South.

Svenska Handelsbanken

 Handelsbanken seems to have adopted the ESG in most if not all of their funds. They use AI to scan company reports to identify the criteria's and which goals each company fulfils based on information about operating countries, products and services. The goals are based on Agenda 2030 and is available in Swedish.

Handelsbanken has 28 funds that based on comparison to other similar funds are positioned in the top percentile of sustainability. Because of the large amount of funds, I will only give the 28 funds as a list below. To analyse all the funds will take a lot of time and that we all have a limited amount of, for English list of Handelsbankens funds please use this link. The mutual funds links are to their euro denominated pages. Note that the amount of funds are due to different currencies and fund "shares". Fund shares might be accumulating or distributing or due to separation of institutional investors and individual investors.

Handelsbanken Asien Tema (available in fund currency of EUR, SEK and NOK, ongoing charges of 1,50% per year)

Handelsbanken Auto 50 Criteria (ongoing charges of 0,60% per year)

Handelsbanken Auto 75 Criteria (ongoing charges of 0,60% per year)

Handelsbanken Brasilien Team (available in fund currency of EUR, SEK and NOK, ongoing charges of  1,85% per year)

Handelsbaken Euro Corporate Bond Fund (available in fund currency of EUR, ongoing charges of 0,65% per year)

Handelsbaken Europa Selektiv (available in fund currency EUR, SEK and NOK, ongoing charges of 1,85% per year)

Handelsbaken Finland Småbolag (available in fund currency EUR and SEK, ongoing charge of 1,80% per year)

Handelsbaken Företagsobligation (available in fund currency SEK, ongoing charges of  0,95% per year)

Handelsbanken Global Dynamisk (available in fund currency SEK, ongoing charges of 0,80% per year)

Handelsbanken Global Selektiv (available in fund currency EUR, SEK and NOK, ongoing charges of 1,85% per year)

Handelsbanken Japan Tema (available in fund currency EUR, SEK and NOK, ongoing charges of 1,60% per year)

Handelsbanken Kapitalförvaltning 50 (available in fund currency EUR, ongoing charges of 1,56% per year)

Handelsbanken Kina Tema (available in fund currency EUR, SEK and NOK, ongoing charges of 1,85% per year)

Handelsbanken Latin Amerika Tema (available in fund currency EUR, SEK and NOK, ongoing charges of 1,60% per year)

Handelsbanken Multi Asset 40 (available in fund currency SEK, ongoing charges of 1,46% per year)

Handelsbanken Multi Asset 50 (available in fund currency SEK, ongoing charges of 1,54% per year)

Handelsbanken Mutli Asset 60 (available in fund currency SEK, ongoing charges of 1,58% per year)

Handelsbanken Mutli Asset 75 (available in fund currency SEK, ongoing charges of 1,61% per year)

There are a few more funds to be mention, however as I want to limit the post you can look for all the rest on Handelsbankens page, link to their fund selection is here. Overall I would say that Handelsbanken has some good funds and some I would challenge on the ongoing charges side, considering the fund owners could get some more contribution.

Notable is that I hold a small position in Handelsbanken funds, all Handelsbanken holdings available in my portfolio.

Nordea

 Nordea has dividend their funds in Star funds and Sustainable balanced funds, Star funds have as criteria that companies are responsible in the sense of environment, human rights, working conditions and business ethics and noted in their operations. Sustainable balanced funds do have the Paris agreement as a criterion, otherwise it seems to be weighted on choosing other ESG funds and creating a balance of it. Note that Nordea does have some Star bond funds of the similar Equity funds mentioned below, however not for all. The selection is available on Nordeas pages at funds now. Besides the tree funds given below there are additional tree funds focused on Europe, US and Asia which I will not cover here.

Global Stars Equity Fund BP-EUR(ISIN: LU0985320059)

 Nordeas Global Stars Equity fund invests as stated in global companies and globally. Funds currency is USD, fees of 1,79% on yearly basis and they apply a entry charge of up to 5% and benchmark index is MSCI All Country World - Net Return Index. Six biggest holdings per 31th March 2021 are Alphabet, Microsoft, Amazon, Rotork, Taiwan Semiconductor Manufacturing and ING Groep representing 17,58% of the total portfolio. Over 70% of the fund is invested in US, a little less than 16% in Europe and around 10% in Asia excluding Japan, geographically it is weighted in US yet the companies we see are global and in reality, if the split would be on revenue basis then the weights would change a bit. in total the fund has 78 positions in companies making it a diversified fund. 

My opinion is that the fund might be a good option for ESG investing, however the ongoing charges of 1,79% and a entry fee of up to 5% makes it expensive considering it has returned around 98 % since launch 2016. Of which most of the return has come in the aftermath of Covid stimulus. If I would buy into this fund, I would like to challenge the portfolio managers a bit on their ability to outperform the market.

Emerging Stars Equity Fund BP-EUR (ISIN: LU0602539867)

Launched in 2011 Nordeas Emerging Stars Equity fund focuses on equities in emerging markets like China, India, Taiwan and South Korea. Fund currency is USD, fees of 1,81% and entry fee of up to 5% and the benchmark index is MSCI Emerging Markets Net Return Index. Six biggest holding are Taiwan Semiconductor manufacturing, Alibaba, Samsung Electronics, Tencent Holdings, Ping An Insurance Group Co of China and Meituna representing 39,38% of all holdings. Around 32% of the holdings are in China, 13% in Taiwan and almost 13% in India. The fund has a total of 47 holdings and the as the geographical split shown heavily invested in China, the weight in China might well be motivated by the size of Chinas economy and therefore there is a lot of opportunity. 

I do find the fund proper if I would like to invest in China or emerging markets, yet the fee does bother me. It is a bit to high in my opinion considering that I could more cheaply create a similar fund in my portfolio. The fund has returned 141 % and beaten the benchmark index, this fund has basically since 2014 kept a good margin to its benchmark index and based on return it has outperformed.

Nordic Stars Equity Fund BP-EUR (ISIN: LU1079987720)

Launched in 2014 Nordeas Nordic Stars Equity fund focuses as the name indicates on Nordic countries and companies, biggest countries are Sweden, Finland, Denmark and Norway. The funds currency is EUR and has ongoing charges of 1,80% and a entry fee of 5%, benchmark index is MSCI Nordic 10/40 Index (Net Return). The six biggest holding are Sampo, Tryg, Gjesidige Forsikring, Novo Nordisk B, Volvo B and Bakkafrost representing 30,52% of the total portfolio and the total amount of holding are 32. Compared to the benchmark index the fund has just outperformed the index since launch, however with a limited margin. interesting is that the fund has one US and one Switzerland holding even though it should be a Nordic Equity funds.

Unfortunately since launch I do not see the fund to have significantly outperformed the benchmark index and considering it has returned 90 % since launch I would more likely take index funds even though they do include less ESG friendly companies.  

Nordeas Sustainable Selection Funds 

Nordea has tree Sustainable Selection funds, a moderate, balanced and growth fund. The difference between these funds is the equity weight. Kindly note that the funds had no mentioning of any easing of charges in the funds they invest, as there are cases where funds in funds are only charged once based on the fund you own directly and not indirectly via a fund.

Sustainable Global Moderate (ISIN: FI4000400080)

 The fund has ongoing charges of 1,18% and the portfolio consists of Nordeas Star funds and other Nordea funds. A fund of funds launched in 2016 with no benchmark index. These funds could be compared to a pension company which distributes assets all over and then returns after expenses a moderate amount to the owner. I would only buy this kind of an fund if I had no other options available due to the additional costs from owning a fund that invests in funds (you pay a fee directly to the fund which has investments in other funds that charge you as well, not a good deal in my opinion). 

The fund has a policy of holding 30% of its funds in equities and the rest is fixed income which explains the low return over the last 10 years. 

Sustainable Global Balanced (ISIN: FI4000400098)

 As the moderate fund this balanced fund has equity holdings of up to 50% and rest in fixed income holdings compared to moderate which has around 30% in equity. The fund was launched in 2016 and has ongoing charges of 1,58% per year and includes Nordea Stars funds and some equity holdings which are already included in the Stars funds. This means that you basically have twice the same holding which I find a bit confusing, to criticize the fund.

Sustainable Global Growth (ISIN: FI4000400106)

Sustainable Global Growth fund has equity holdings of 70% and the rest in fixed income assets, compared to the other Sustainable funds the equity weight is bigger and therefore a better return than the other funds. Ongoing charges per year are 1,62% and the fund was launched in 2016, no benchmark index given.

The fund does include Nordea Stars funds and bond funds as well as direct equity holdings of companies in the Stars funds. The difference is that the equity holdings are more and covers a bit larger sample then the Stars funds. What bothers me with the funds is the weight in Nordea 2 Global Sustainable Enh. Eq. Fd Y- EUR fund of 19,26%. 

Nordea selection summary

Nordea does have a few ESG funds from which you can choose, and I assume there might be something interesting for all, what bothers me are the high fees. Unfortunately, funds do have higher fees then ETFs due to the additional work from following up of cash flows and most likely some other costs which I do not know, but I assume we all agree that over 1,1% annual fees are quite high.

 JPMorgan ETFs (Ireland) ICAV - Carbon Transition Global Equity UCITS ETF (JPCT)

The ETF follows the underlying index which is JPMorgan Asset Management Carbon Transition Global Equity Index (JPMIGCTN). Balancing is done on a quarterly basis and has a fee of 0,19% and no performance fees with 1,1 million shares outstanding. The fees is low due to it being a index fund, it was established in 2020 and currency is USD. Biggest holdings are Apple, Microsoft, Alphabet A (Google), Amazon, Facebook and Johnson&Johnson representing 15,5% of the ETFs holdings. The fact sheet as well as KIID is available on the funds page which you can reach via ticker.

For me the question is more based on what criteria this ETF has chosen ESG fulfilling companies? It only states to be following an index created by the company, for information purpose to investors and potential investors it could be good to explain a little more what the ESG criteria is, a few sentences is enough on the homepage. J. P. Morgan has a webpage where they introduce the whole policy around ESG investing and it seems to be weighted towards Paris agreement and dedicated sustainability agenda. 

J. P. Morgan has a lot of SICAV funds under their EGS investment policy, more than a few posts would be able to handle so have decided not to look at them in this post. If you are interested in what funds they have then you click the link. It will take you to the main page from where you can look at their whole selection of ESG investment funds and ETFs, ranging from equities to bonds and all in between.

Summary

There are a lot of funds and ETFs stating and following an ESG investment policy. The issue is to find what fits you best and what you broker or bank has available. 

One question that I have and find important with ESG investing is, why are fossil fuel companies left out? Should we maybe see these companies as an opportunity to change instead of seeing them as the evil monster? Maybe consumers behaviour should also be reviewed and companies products? How long does the products last and how often do they launch new models that drive consumption and increase waste? For example electronical recycling in Europe has already been proven to work badly with a lot ending up in Africa as waste instead of recycled as promised. 

Relating to the trend of ESG investing and green future, there is a small issue of free riding that will occur here. As many investors can choose a low-cost fund covering the same companies while other might choose an impact fund that will work for the changes. In the example of Blackrock and iShares ETFs I do believe Blackrock will work for the total good via all their funds in which case they have a big impact due to the size and amount of their funds. If I remember correctly Larry Fink the CEO of Blackrock said back in 2020 that Blackrocks funds will start impacting company Boards and management to work for more sustainable future. 

Compounding interest in ESG investing

If we quickly look at my portfolio composition from ESG perspective then Telia Company might be one to criticize due to their history of bribes given in old Soviet states. Canadian Utilities seem to move towards a more green perspective and for the rest of the companies and funds I would say it might be on a good stand. One problem is that I cannot get information on how how well the employer treates employees, if the management is in reality good and humane (off stage as well as on stage).  One way could be the amount of sickdays and weighted average numbers of years at employer on all levels including internal possibilities of career. Much more can be added, such as to what extent empoyee suggested improvements are initiated by management.

Which ESG ETF or mutual fund would I choose? Would not choose one single, instead mix with a few iShares, one Vanguard, some Handelsbanken spiced with one or two Nordea. Might consider J.P. Morgan ETF, however do want to limit my US large Cap risk and not that confident with Facebook and Tesla as ESG investments.

If you find any link not working please reach out to me in the comments or e-mail to edgwhstudio@gmail.com to ensure the links are updated as banks and investment houses might change the url from time to time. 

Disclaimer;

Of the mutual funds and ETFs mentioned in this post per publishing day I only have positions in a few Handelsbanken funds and a few iShares ETF. I do not have any personal financial interest in mentioning nor do I receive any compensation of any form from any of the mentioned entities. This post shall not be interpreted as financial advice nor is it, the reader is fully responsible for own financial decisions.